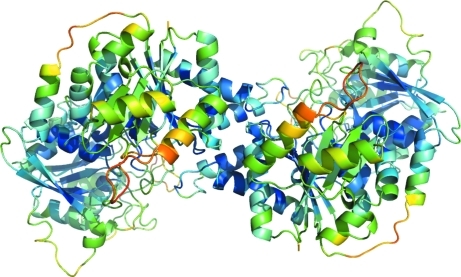
Figure 4.
Dimeric structure of S. solfataricus CTP synthase colour-coded according to the backbone thermal parameters. Blue indicates low thermal parametes and red indicates large thermal parameters. The synthase domain is at the front. This figure was prepared in PyMOL (DeLano, 2002 ▶).

