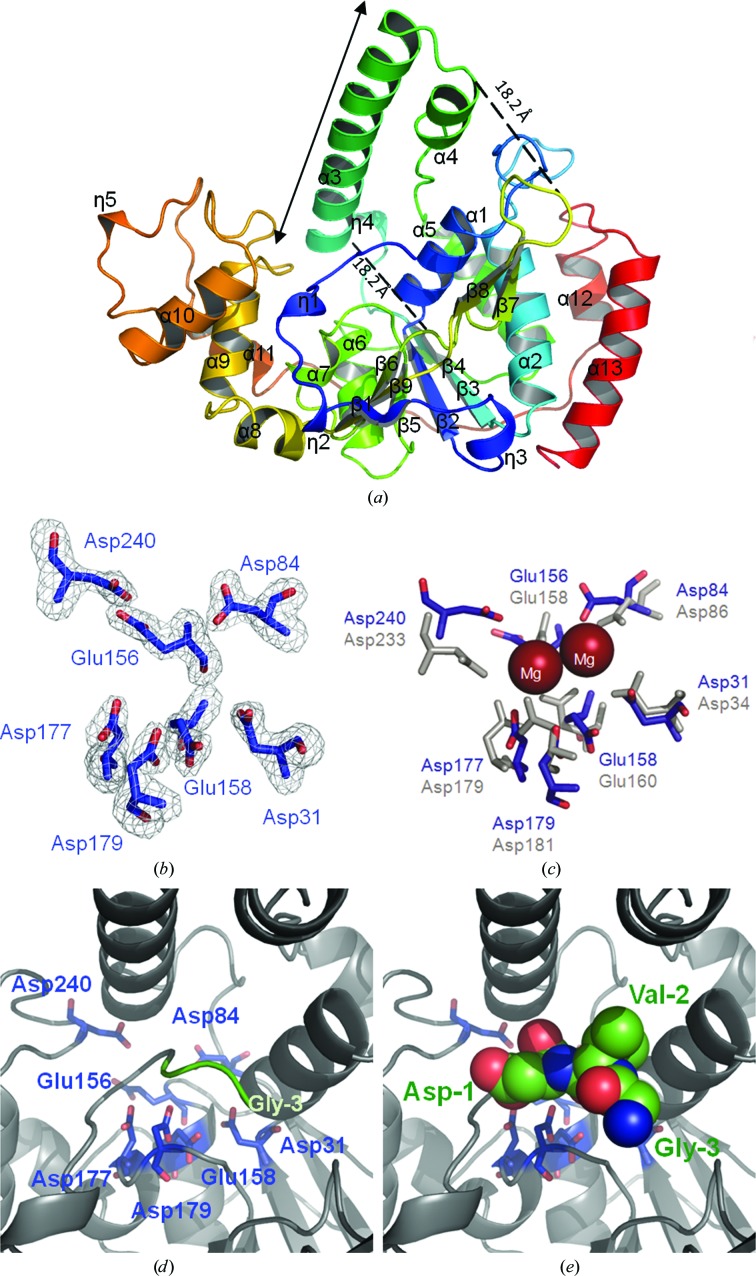
Figure 1.
Structure of DaFEN1. (a) Ribbon diagram of DaFEN1. Colour-coding runs from blue at the N-terminal region to red at the C-terminal region. Secondary-structure assignments are labelled on the ribbon model. (b) σA-weighted F o − F c OMIT map of the putative active site of DaFEN1. The map is contoured at 4σ. (c) Proposed Mg2+ positions in the DaFEN1 active site based on superposition of the DaFEN1 (blue) and hFEN1 (grey) active-site residues. Mg2+ ions are shown as red spheres. (d) Active-site structure of DaFEN1. Active-site acidic residues are shown as blue stick models. (e) Structure of the additional N-terminal residues of DaFEN1. These residues (Gly−3, Val−2 and Asp−1) are shown as sphere models.

