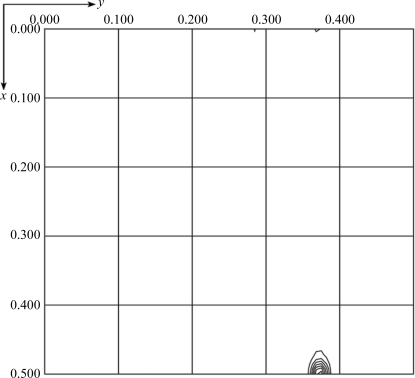
Figure 6.
Native Patterson map calculated from 30 to 2.7 Å resolution for the form I crystal. The plot shows fractional coordinates u and v ranging from 0.0 to 0.5 and w = 0.5 at the Harker section. An intense pseudo-origin peak appears at (u, v) = (0.5, 0.378). The figure was prepared using FFT from the CCP4 suite.

