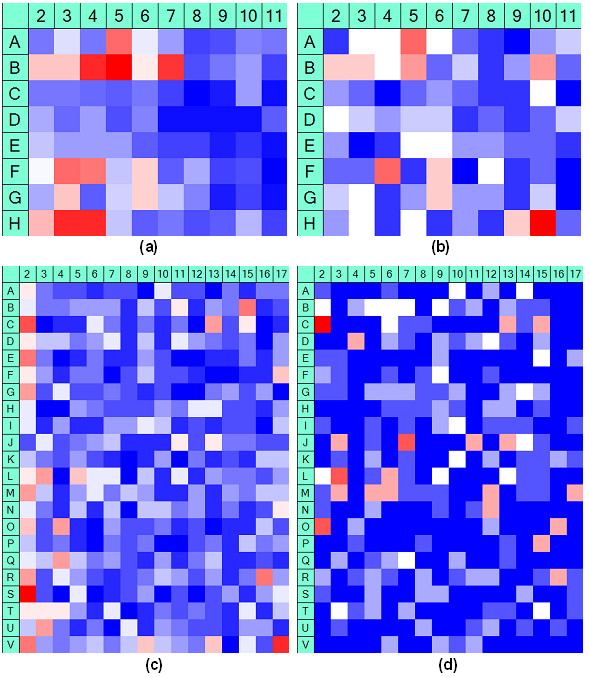
Figure 1.

Systematic error in experimental HTS data. Hit distribution surfaces for the McMaster (cases (a) and (b) - 1250 plates - [18]) and Princeton (cases (c) and (d) - 164 plates - [19]) Universities experimental HTS assays. Values deviating from the plate means for more than 2 standard deviations - cases (a) and (c), and for more than 3 standard deviations - cases (b) and (d) were selected as hits. The well, row and column positional effects are shown (the wells containing controls are not presented).
