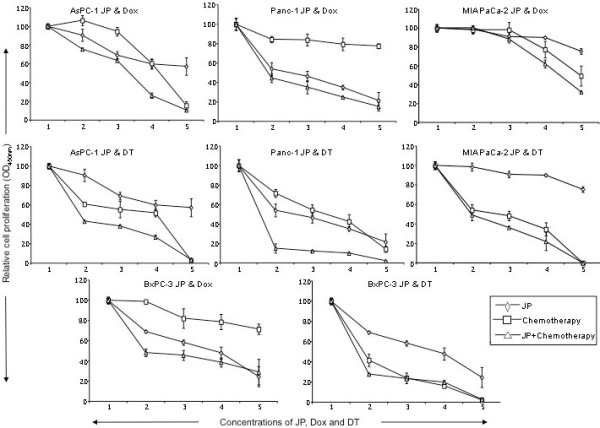
Figure 3.

Effects of JP, doxorubicin and docetaxel on in vitro cell proliferation of AsPC-1, Panc-1, MIA PaCa-2 and BxPC-3 PDAC cell lines. Cells were plated on 96-well plates and treated with JP, Dox or DT, either alone or in combination. X-axis numbers represent treatment concentrations of JP, Dox and DT. Number 1 represents control, number 2 represents JP 100 nM, Dox or DT 10 nM, number 3 represents JP 1 μM, Dox or DT 100 nM, number 4 represents JP 5 μM, Dox or DT 1 μM, and number 5 represents JP 10 μM, Dox or DT 10 μM.
