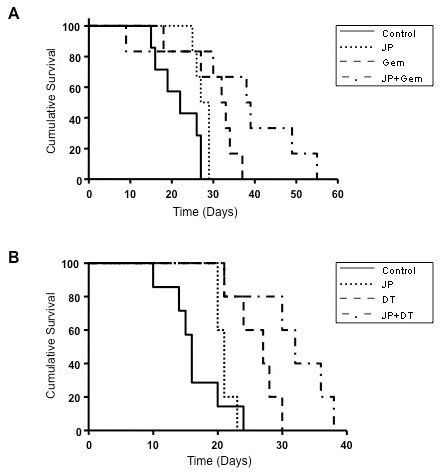
Figure 6.

Effects of JP, Gem and DT, either alone or in combination on animal survival. AsPC-1 cells (0.75 × 10⁶) were injected intraperitoneally in SCID mice and treatment started after 12 days. (A) Mice were treated with PBS (control), JP, Gem and JP + Gem for 14 days. The curve represents the survival time from the beginning of therapy. The p values for survival differences after Gem and JP + Gem versus control are 0.02 and 0.01, respectively; JP + Gem versus Gem: p = 0.06; JP + Gem versus JP: p = 0.02. (B) Mice were treated with PBS (control), JP, DT and JP + DT for 14 days. The curve represents the survival time from the beginning of therapy. The p values for survival differences after DT or JP + DT treatment versus control were 0.006; JP + Gem versus Gem: p = 0.05; JP + Gem versus JP: p = 0.04.
