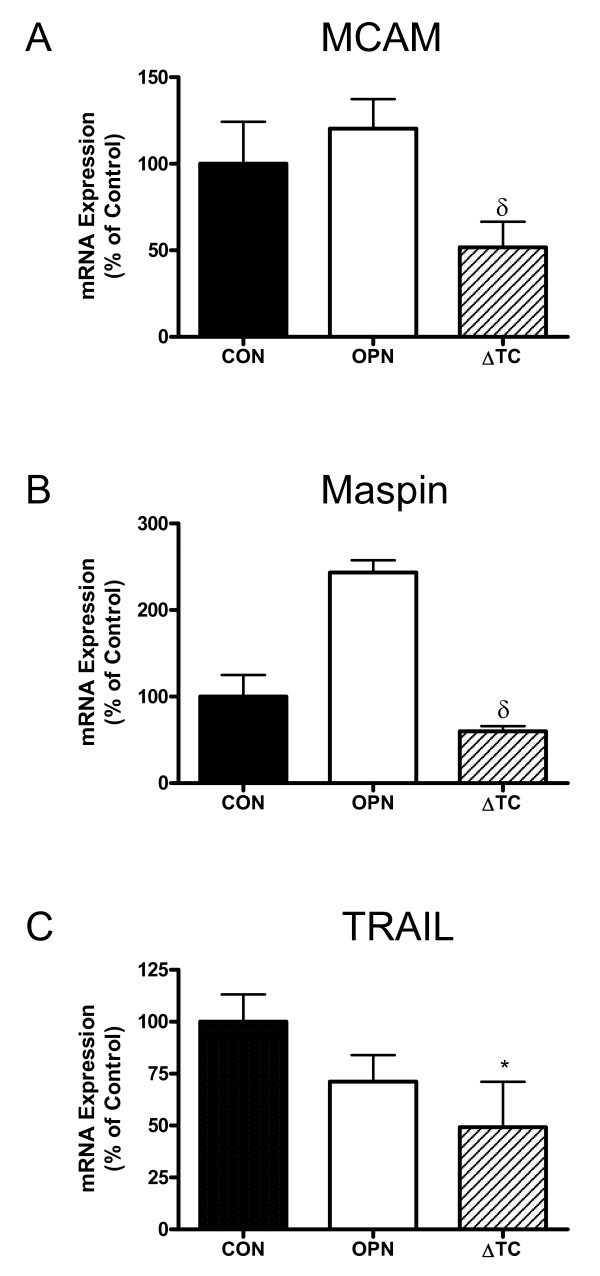
Figure 5.
mRNA expression of MCAM, Maspin and TRAIL in 468-CON, 468-OPN and 468-ΔTC cells. Quantitative RT-PCR analysis of mRNA levels collected from cells grown on 3 separate 60 mm dishes over 3 experiments. Expression was adjusted to GAPDH internal control. (A) MCAM, (B) Maspin, and (C) TRAIL expression are represented as % control of 468-CON, mean +/- SEM. * = sig. different than corresponding treatment of 468-CON (p < 0.01); δ = sig. different than corresponding treatment of 468-OPN (p < 0.01).

