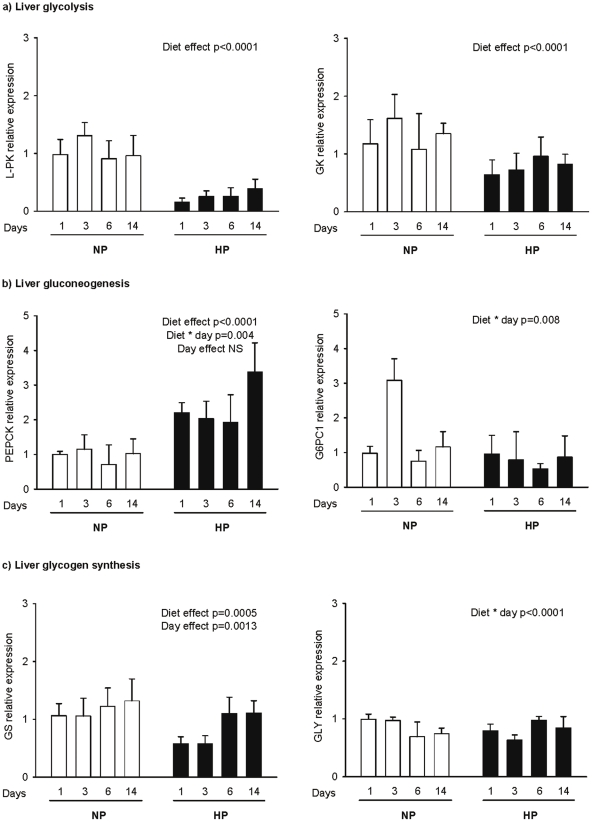
Figure 1. Postprandial hepatic gene expression profiles for carbohydrate metabolism.
Gene expression was determined for the key enzymes involved in: (a) glycolysis (L-PK, GK), (b) gluconeogenesis (PEPCK, G6PC1) and (c) glycogenogenesis (glycogenin, GS) 2 h after intake of a calibrated meal consisting of 4 g of NP or HP diet for rats fed previously a normal or a high protein diet for 1, 3, 6 and 14 days (NP1, NP3, NP6, NP14 and HP1, HP3, HP6, HP14, respectively). mRNA levels were measured by real time RT-PCR and expressed in comparison to the reference gene (18S). Data are expressed as means±SEM relatively to NP1 (n = 5). The statistical differences (P<0.05) are shown at the bottom of each graph (two-way ANOVA test).

