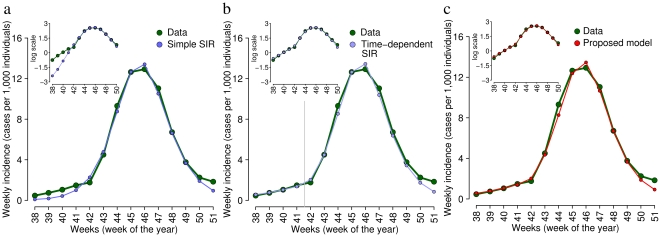
Figure 1. Comparing observed ILI incidence and model simulations.
a Weekly ILI incidence as reported to the surveillance system (green) and weekly incidence simulated by a “simple” SIR model (blue). Sub-panel shows the same curves in a logarithmic scale. Parameter values assumed in the simulation are: the generation time  days [48]–[50] and
  , according to a serological survey on the Italian population [47]. Parameter values estimated via model fit are:
  ,
,  and
and  . b Weekly ILI incidence as reported to the surveillance system (green) and weekly incidence simulated by a SIR model assuming a time-dependent transmission rate (blue). Sub-panel shows the same curves in a logarithmic scale. Assumed parameters are:
  days and
  . Values of the fitted parameters are:
  ,
,  ,
,  for weeks 38–41.58 and
  for weeks 41.58–51. c Weekly ILI incidence as reported to the surveillance system (green) and weekly incidence simulated by the proposed model (red). Sub-panel shows the same curves in a logarithmic scale. Assumed parameters are:
  days,
days,  ,
,  and
and  . The values of the fitted parameters are:
  ,
,  ,
,  ,
,  ,
,  ,
,  and
and  . In addition, the estimates of the reporting factor
  as obtained by fitting the three models and reported in a, b and c (namely, 17.4%, 16.7% and 16.9%, respectively) are in good agreement with the range 18%–20.2% estimated in [30].

