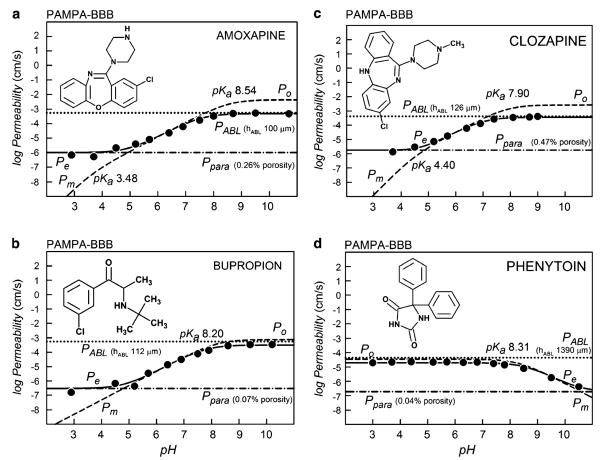
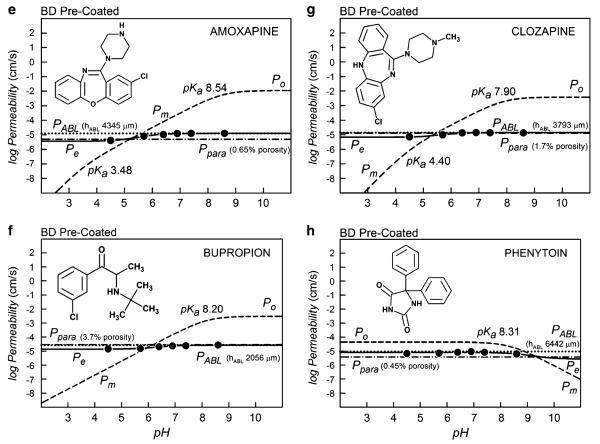
Fig. 1.
The log permeability vs. pH plots of four of the 108 molecules determined by the PAMPA-BBB method. The a–d frames are based on 3 μL PBLE lipid coated filters, while the e–h frames are based on the 1 μL 4%w/v DOPC in hexadecane BD pre-coated filter plates. The pH was varied to assess the contribution of the aqueous boundary layer and the shunting effect of the paramembrane aqueous pores. The best-fit of the log form of Eq. 1 to the measured effective permeability data, Pe vs. pH, are represented by the solid curves, and the paramembrane- and ABL-corrected log Pm vs. pH curves are represented by dashed curves. The dot curves correspond to the log PABL values, and the dot-dash curves correspond to the paramembrane permeability, log Ppara. The maximum point in the log Pm curves corresponds to the intrinsic permeability coefficient, log Po, which characterizes the permeability of the neutral form of an ionizable molecule. The intersections of the horizontal and the diagonal tangents occur at pH values corresponding to the pKa in the dashed curves. The dynamic range window, DRW, is the permeability gap defined by log PABL at the top and log Ppara at the bottom.


