
Fig. 10. Representative examples of age-regulated expression change trendlines (in disease-promoting directions) for two familial PD genes in four human brain areas.
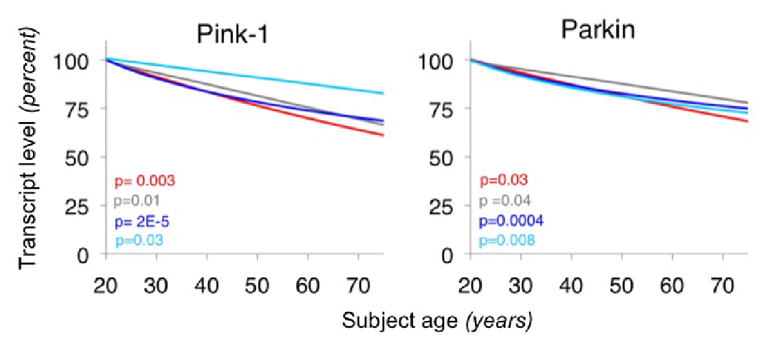
Adapted from (Glorioso et al., 2010). Regression lines of cross-sectional scatter plots of subject age versus gene expression (from human post-mortem array data) are depicted for two PD genes in four brain areas (anterior cingulate cortex (red), amygdala (grey), prefrontal cortex (PFC), BA9 (royal blue), and PFC BA47 (turquoise)). Individual subject data points were removed for visual clarity. Uncorrected p-values associated with regression lines (expression vs. age) are displayed in the lower left of graphs. Substantial ~15–35% drops in expression from age 20 to age 80 can be seen in each area and are directionally conserved across areas and studies. The direction of these changes are predicted to be promoting PD.