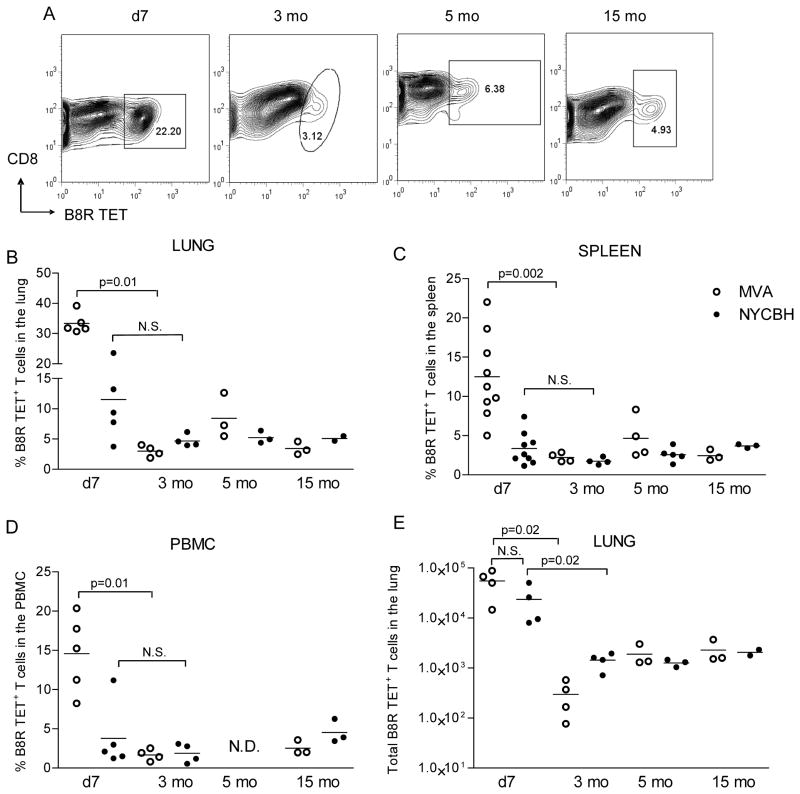
Figure 1. Long term TET+ frequencies in target organs of immunized mice.
Using the gating strategy shown in Fig S1 to identify live CD3+CD8+ T cells, (A) representative frequencies of B8R20 27 TET+ T cells in the lung lymphocytes of mice immunized with NYCBH 7 days, 3, 5 and 15 months earlier are shown. Frequencies of TET+ cells in the (B) lung, (C) spleen (D) PBMC and (E) the absolute numbers of TET+ T cells in the lungs of MVA and NYCBH immunized animals are depicted at the indicated time points post immunization. Each symbol represents the frequency of TET+ T cells obtained in target organs of individual mice; mean values are denoted by horizontal lines. p values <0.05 were considered to be significant.

