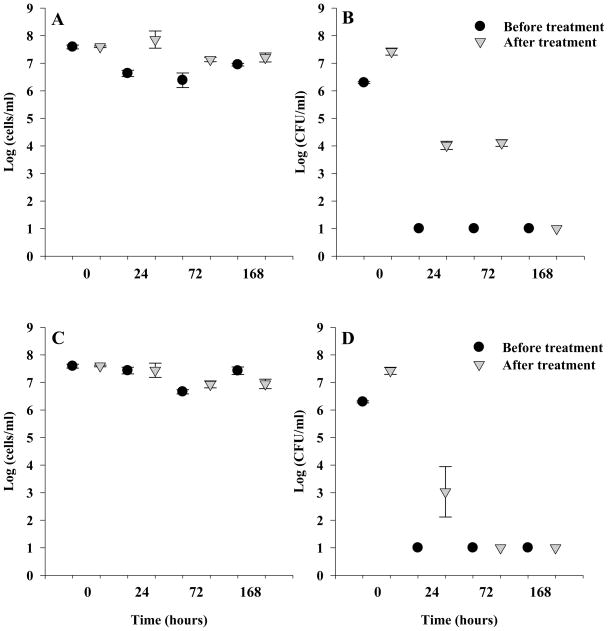
Figure 1.
Depicts the total cell and culturable colony counts from H. pylori before and after resuscitation. Symbols indicate mean counts of three independent biological replicates (cells/ml or CFU/ml), error bar indicate 1 standard deviation. For comparison, time zero in all graphs is positive control healthy cells grown in biphasic slant before and after resuscitation 1A) Oxygen stressed total cell counts sampled at 24, 72 and 168 h before and after resuscitation. 1B) Oxygen stressed colony counts sampled at 24, 72, and 168h before and after resuscitation. 1C)Nutrient deprived total cell counts sampled at 24, 72 and 168 h before and after resuscitation. 1D) Nutrient deprived colony counts sampled at 24, 72 and 168 h before and after resuscitation. One log (CFU/ml) was the detection limit for culturable cells.

