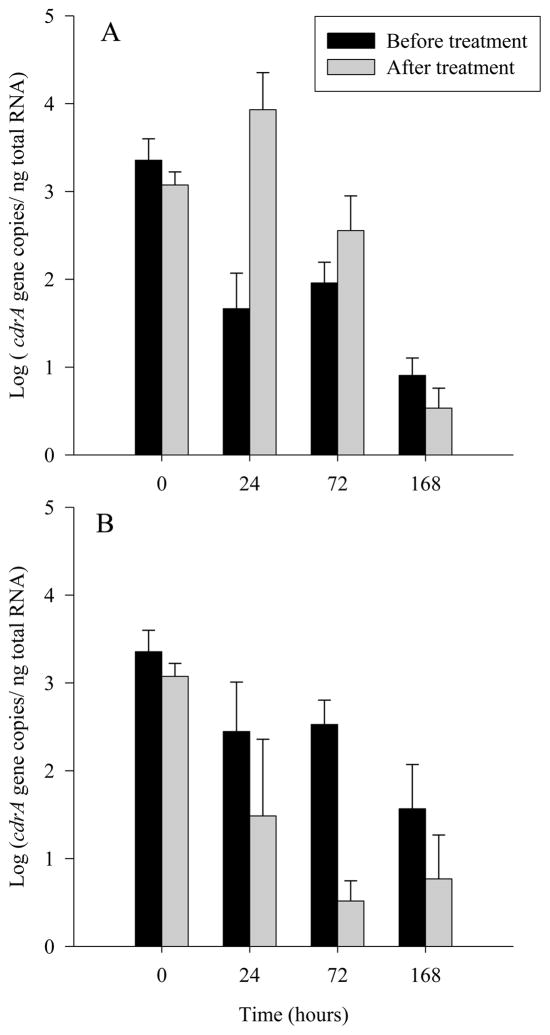
Figure 2.
Transcription of the gene cdrA in A) oxygen stressed and B) nutrient deprived H. pylori before and after treatment with R broth. The X-axis indicates the hours of stress exposure. Graphs represent mean measurements of three biological replicates and error bars represent ± 1 standard deviation.

