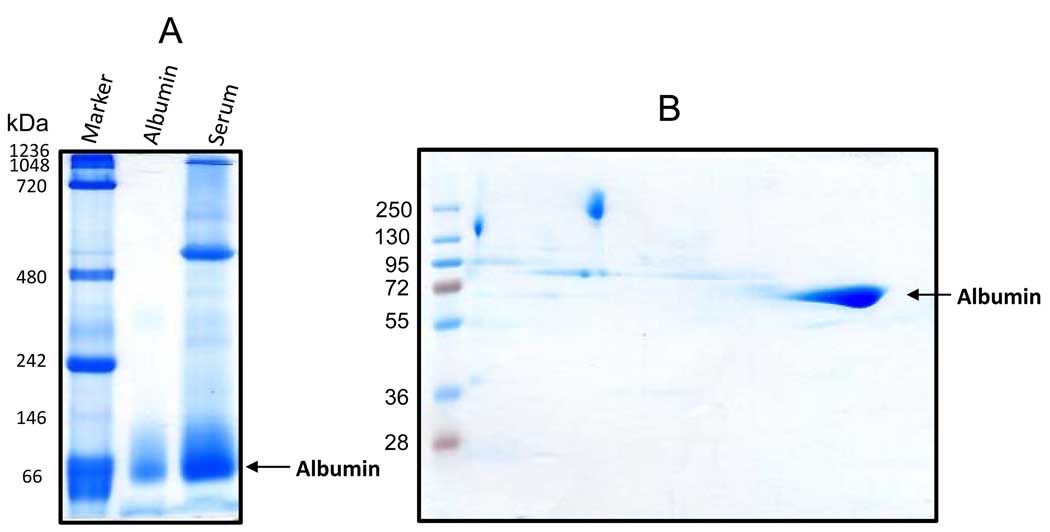
Figure 1.
Nongradient BN-PAGE and second dimensional SDS-PAGE resolution of rat serum proteins. (A) Protein band patterns resolved on a 12% blue native gel visualized by Coomassie blue staining. Serum was diluted to 2 mg/ml with BN-PAGE sample buffer containing 50 mM Bis-Tris (pH 7.0), 1% n-dodecyl-β-D-maltoside (v/v) and 750 mM ε-amino-N-caproic acid. Sixty micrograms of serum proteins was loaded. Native gel protein markers used in this figure as well as in other figures where indicated are: thyroglobulin, 669 kDa; ferritin, 440 kDa; catalase, 232 kDa; lactate dehydrogenase, 140 kDa; BSA, 67 kDa. Pure rat albumin was used as a positive control (the middle lane). (B) Second dimensional SDS-PAGE analysis of a blue native gel strip showing the spot that belonged to albumin.

