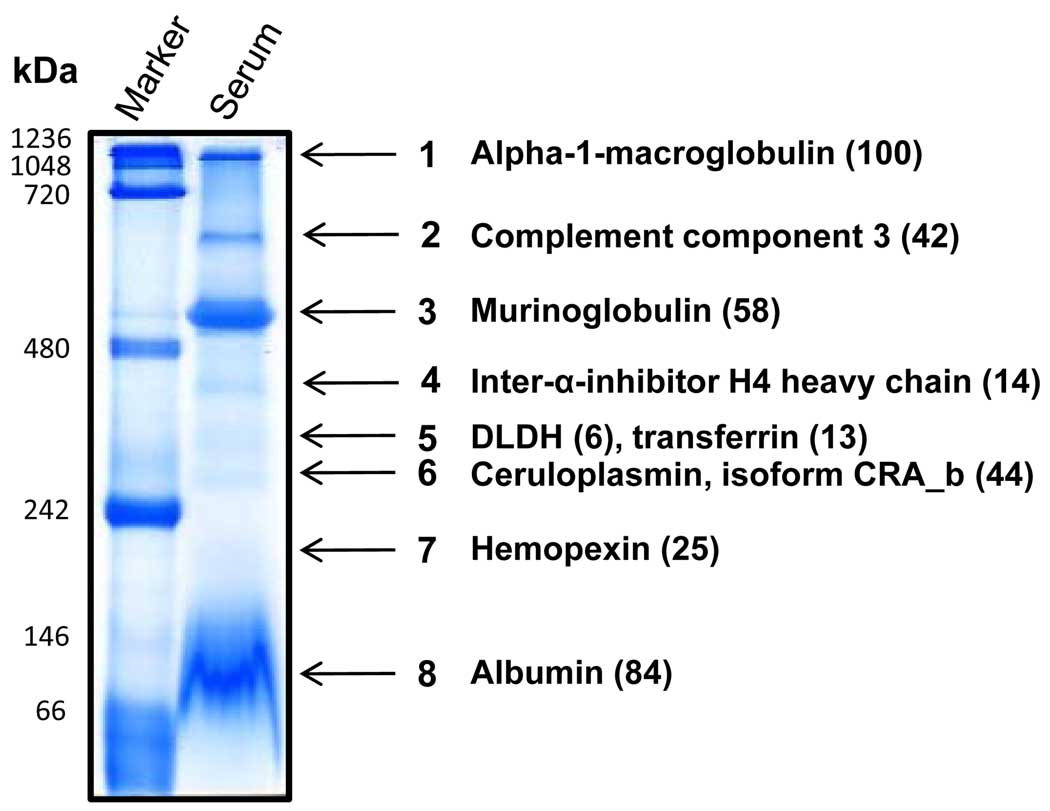
Fig. 2.
Identification of major proteins/protein complexes in rat serum. Blue native gels were stained by Coomassie blue and gel bands were excised for LC-MS/MS peptide sequencing. For each band, only the protein that was the most abundant is shown, except for band 5, where DLDH is also shown. A list of DLDH associated proteins is given in Table 1 and a complete list of the identified proteins in the rest of the bands is provided in supplemental Tables 1 to 3. Values in the parenthesis indicate the spectral count number for the corresponding protein.

