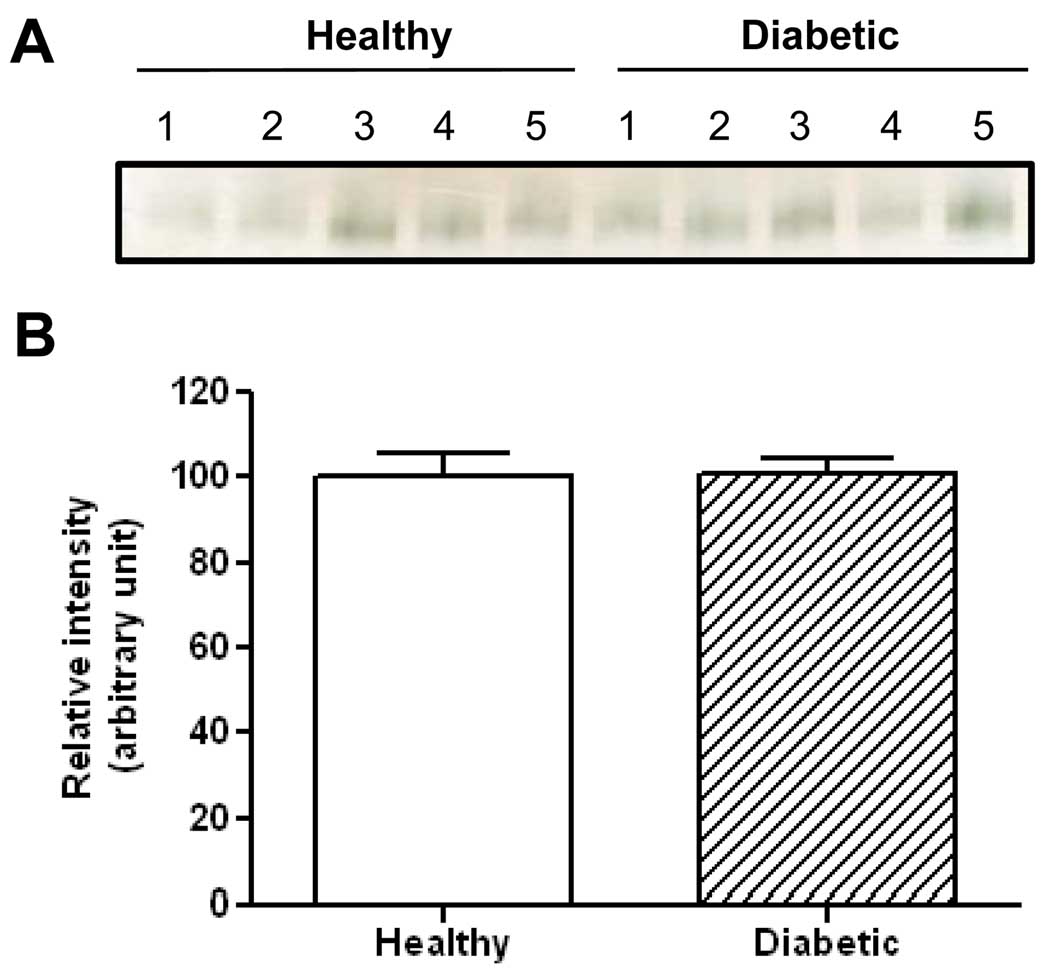
Fig. 8.
Comparison of serum butyrylcholinesterase activity between control subjects and type II diabetic patients. The serum samples were obtained from Bioserve (Beltsville, MD) with each group containing 5 subjects. (A) Image of in-gel activity staining performed as described in Fig. 3; (B) Densitometric quantifications of the bands in (A). Quantification was performed using Scion Image software (version 4.0.3); values are expressed as percentage of controls. Note that the enzyme activity measured was gross activity based on the same amount of proteins loaded for each sample.

