
Fig. 3.
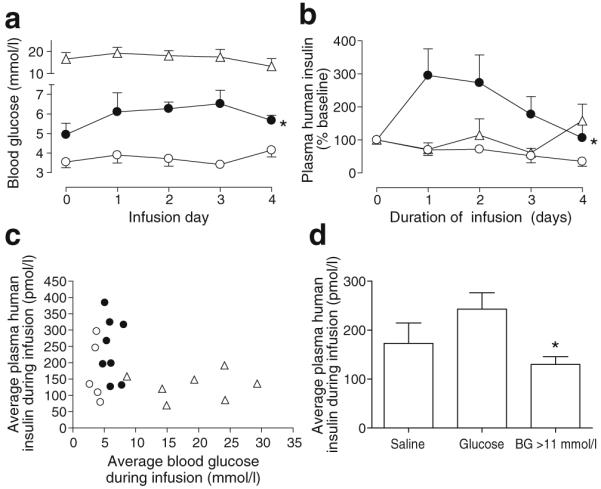
Metabolic environment during the period of BrdU exposure. a Blood glucose remained elevated in the >11 mmol/l blood glucose group (triangles) and low in the normoglycaemic saline group (white circles), but increased slightly in mice receiving glucose infusions (black circles). *p=0.0009 vs saline by two-way ANOVA (pre-infusion sample at time zero excluded). b Plasma human insulin levels increased relative to baseline in the glucose-infused group (black circles); *p=0.04 vs saline (white circles) by two-way ANOVA (pre-infusion sample at time zero excluded). White triangles, >11 mmol/l blood glucose. c Average blood glucose and human insulin values for each mouse over the infusion period show that the majority of grafts maintained glucose and insulin within a defined region. Plasma insulin was not measured for one mouse in the >11 mmol/l blood glucose group (triangles) and in one mouse in the saline group (white circles). Black circles, glucose infusion. d During BrdU exposure, grafts in the >11 mmol/l blood glucose (BG) group showed relatively lower circulating human insulin than grafts in mice infused with glucose. *p<0.05 for blood glucose >11 mmol/l vs glucose infusion by one-way ANOVA