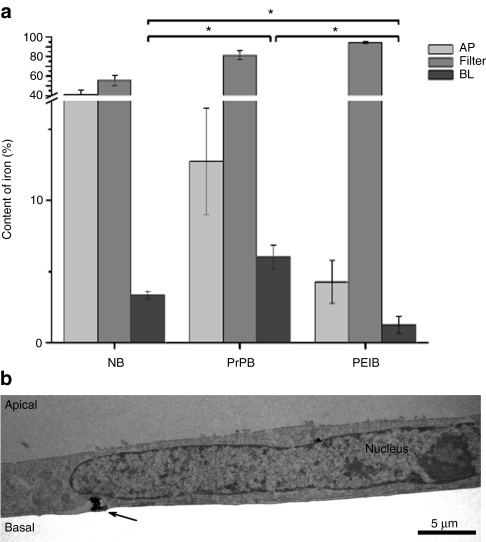
Figure 5.
Transcytosis of nanoparticles across a monolayer of endothelial cells. (a) hCMEC/D3 cells were cultured on Transwell filters. Nanoparticles were added to the apical compartment and incubated for 18 hours. The total amount of iron was measured in the apical and basal compartment, and in the filter membrane with the cells. Transcytosis is presented as amount of iron in the apical compartment divided by the total amount of iron in the three compartments, and expressed as percentage (mean ± SEM, n = 3). Asterisks indicate significant differences (P < 0.05) in transcytosis of NBs versus PrPBs, PrPBs versus PEIBs, and NBs versus PEIBs, as evaluated with the Student's t-test. (b) Electron micrograph of a prion-coated particle (arrow) exocytosed at the abluminal side of a monolayer of hCMEC/D3 cells. AP, apical; BL, basal; NB, noncoated bead; PEIB, polyethyleneimine-coated bead; PrPB, prion-coated bead.

