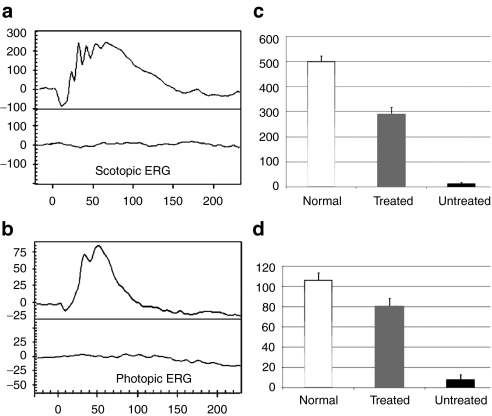
Figure 2.
Scotopic and photopic electroretinogram (ERG) in treated and untreated rd10 eyes. (a) Representative scotopic ERG elicited from 0.4 log cd-s/m2 intensity in an rd10 eye 6 months following treatment at P14 (upper) compared with that of the untreated eye (lower) from the same rd10 mouse; y axis: 20 µV/Div, x axis: 50 ms/Div. (b) Representative photopic ERGs elicited at 1.4 log cd-s/m2 from the same rd10 mouse (upper, treated; lower, untreated); y axis: 5 µV/Div, x axis: 10 ms/Div. (c) Average scotopic b-wave amplitudes elicited at 0.4 log cd-s/m2 in age-matched, uninjected normal C57 BL/6J (left), treated (middle), and untreated (right) rd10 eyes; (d) Averaged photopic b-wave amplitudes elicited at 1.4 log cd-s/m2 in age-matched, uninjected normal C57 BL/6J (left), treated (middle), and untreated (right) rd10 eyes.

