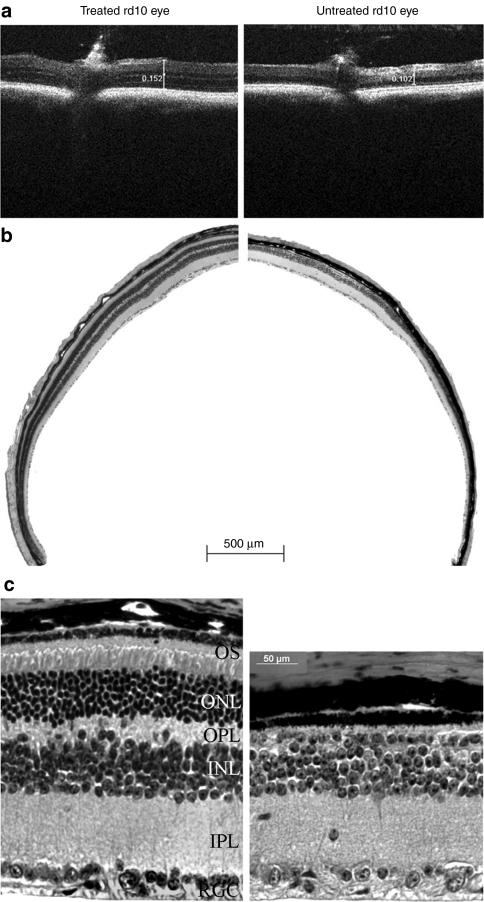
Figure 4.
Bioptigen spectral domain optical coherence tomography (SD-OCT) and light microscopic (LM) images of treated (left) and untreated (right) eyes from one rd10 mouse. (a) OCT images at same location (3 mm temporal to the optic nerve) from representative treated and untreated rd10 eyes. Scale calipers on each image are placed at equivalent distances from the optic nerve to quantify the distance from the vitreal face of the ganglion cell layer to the apical face of the RPE (152 millimeters for the treated eye and 102 millimeters for the untreated eye). (b) Low-magnification images from the treated and untreated eyes of the same rd10 mouse used in a. Note the presence of outer segments and continuous, intact outer nuclear layer (ONL) in the treated eye and their absence in the untreated eye. (c) High magnification LM images from the treated and untreated eyes of the same rd 10 mouse used in b. OS, outer segments; OPL, outer plexiform layer; INL, inner nuclear layer; IPL, inner pexiform layer; RGC, retinal ganglion cell.

