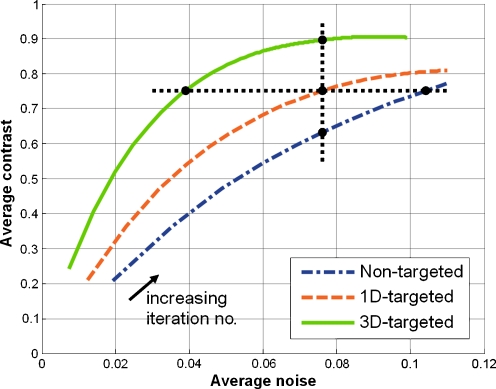
Fig. 5.
Average defect contrast as a function of average noise in the mouse myocardial phantom. Curves were generated by interpolating values found at different iterations (dash-dots nontargeted, dashes 1D-targeted, solid 3D-targeted). Comparisons at equal contrast and at equal noise, as described in the text, are illustrated using markers connected by dotted lines

