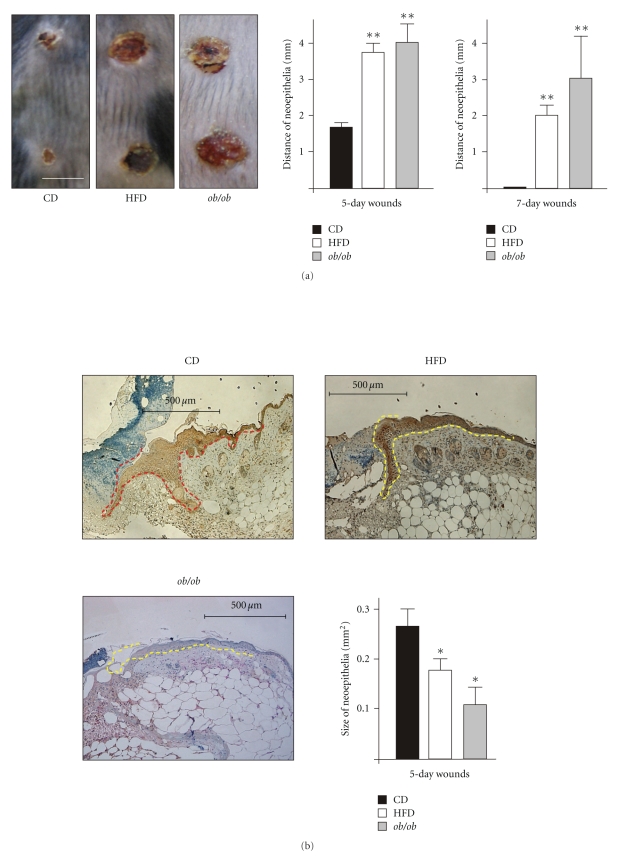
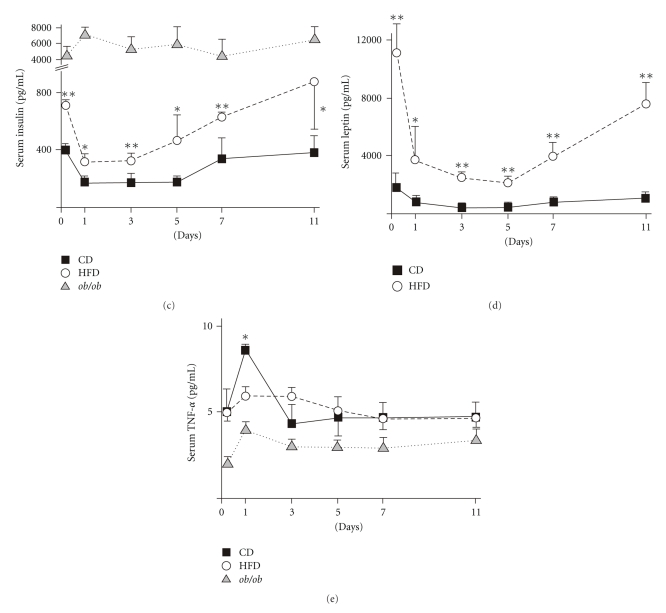
Figure 2.
Wound closure and systemic effects of wounding. (a) 5-day wounds in CD-fed, HFD-fed and ob/ob mice (left panel). Distances of neoepithelia in cross-sectional areas of 5-day and 7-day wounds of CD-fed, HFD-fed and ob/ob mice (right panels). (b) Histologies showing wound neoepithelia of CD, HFD or ob/ob mice as indicated. Scale bars = 500 μm. The epithelial margins are indicated by a yellow line. Panel: areas of wound margin neoepithelia in CD, HFD and ob/ob mice. **P < .01 versus CD-fed mice. Bars indicate the mean ± SD obtained from 8 wounds (n = 8) from 4 individual animals (n = 4). (c) Serum insulin, (d) Leptin and (e) TNF-α levels in CD-fed, HFD-fed or ob/ob mice before wounding and during different days of healing as indicated. **P < .01; *P < .05 versus CD-fed mice. Each single experimental time point depicts the mean ± SD obtained from 4 individual animals (n = 4).


