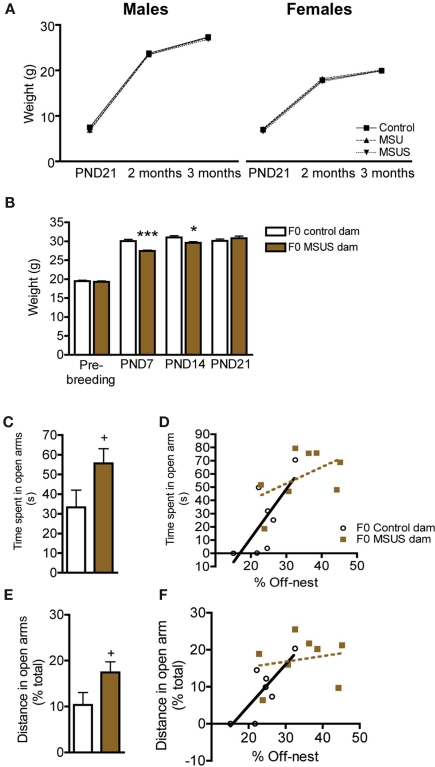
Figure 1.
Body weight in F1 control, MSU and MSUS, and body weight and behaviors in F0 control and MSUS dams. (A) F1 MSU males (n = 21) and F1 MSUS males (n = 23), and F1 MSU females (n = 20) and F1 MSUS females (n = 26) had normal body weight despite early stress treatment compared to F1 control males (n = 25) and F1 control females (n = 20), respectively. (B) Reduced body weight in F0 MSUS dams (n = 11) during the period of separation (PND7 and PND14), but no significant difference 1 week after the end of separation (PND21; not measured in MSU females), compared to F0 control dams (n = 12). (C) Increased time spent in the open arms in F0 MSUS dams (n = 8) compared to F0 control dams (n = 8). (D) Significant correlation between time spent in open arms and time spent off-nest in F0 control dams, but not in F0 MSUS dams. (E) Increased proportion of total distance covered in the open arms in F0 MSUS dams (n = 8) compared to F0 control dams (n = 8). (F) Significant correlation between distance in open arms and time spent off-nest in F0 control dams, but not F0 MSUS dams. 0.05< + <0.1; *p < 0.05; ***p < 0.001. Bar graphs represent mean values ± SEM.

