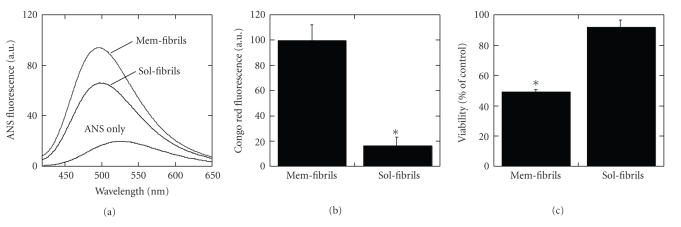
Figure 3.
Comparison between Mem-fibrils and Sol-fibrils. Data taken from [20]. (a) Fluorescence spectra of ANS (5.0 μM) in PBS were measured in the absence or presence of Mem-fibrils and Sol-fibrils of Aβ-(1–40) (2.5 μM) with an excitation wavelength of 350 nm. The binding of the dye to a hydrophobic surface results in an enhancement in fluorescence intensity. (b) Aβ-(1–40) fibrils (25 μM) were incubated with NGF-differentiated PC12 cells for 30 min. Binding of Aβ-(1–40) fibrils to cells was evaluated by fluorescence intensity of Congo red per cell (mean ± S.E.; n ~ 100, *P < .001). (c) Aβ-(1–40) fibrils (25 μM) were incubated with NGF-differentiated PC12 cells for 24 h. Aβ cytotoxicity was estimated with fluorescence intensity of the live cell marker calcein (mean ± S.E.; n = 6; *P < .001 against vehicle treatment).

