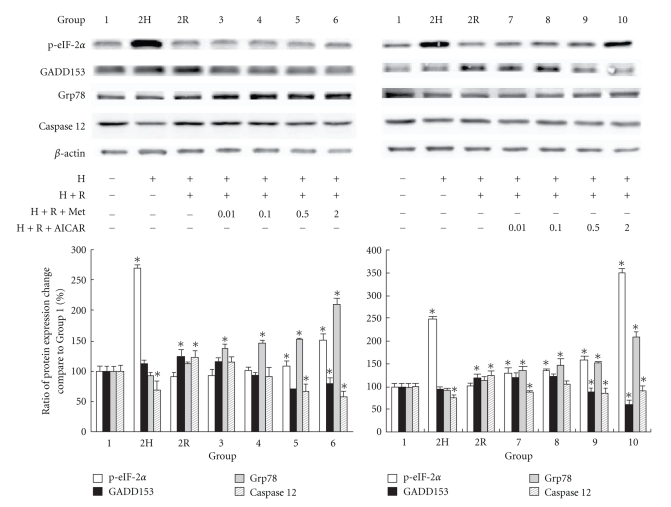
Figure 2.
The results of western blot analysis of phosphorylated eIF-2α, GADD153, Grp78, and caspase-12 (B) in different groups are shown. β-actin was used as internal control. (Results are representative of at least 3 separate experiments. *P < .05 compared with Group 1; H: hypoxia; R: reoxygenation; Met: metformin.)

