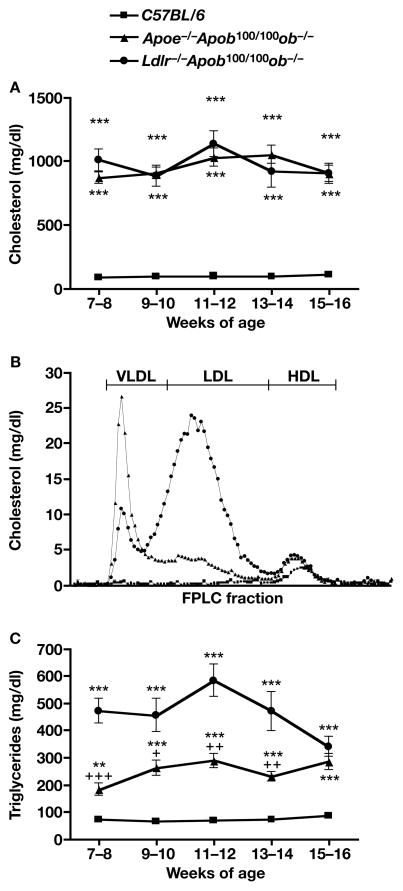
Figure 12.
Plasma lipid levels and lipoprotein profiles in Apoe−/−Apob100/100ob−/− and Ldlr−/−Apob100/100ob−/− mice. (A) Cholesterol levels in Apoe−/−Apob100/100ob−/−, Ldlr−/−Apob100/100 ob−/−, and C57BL/6 mice (n = 7–16). (B) Distribution of cholesterol in the plasma lipoproteins of Apoe−/−Apob100/100ob−/−, Ldlr−/−Apob100/100 ob−/−, and wild-type C57BL/6 mice. A total of 2–5 μl of fresh plasma was used for HPLC-fractionation of the plasma. (C) Triglyceride levels in Apoe−/−Apob100/100ob−/−, Ldlr−/−Apob100/100ob−/−, and C57BL/6 wild-type control mice (n = 7–18).

