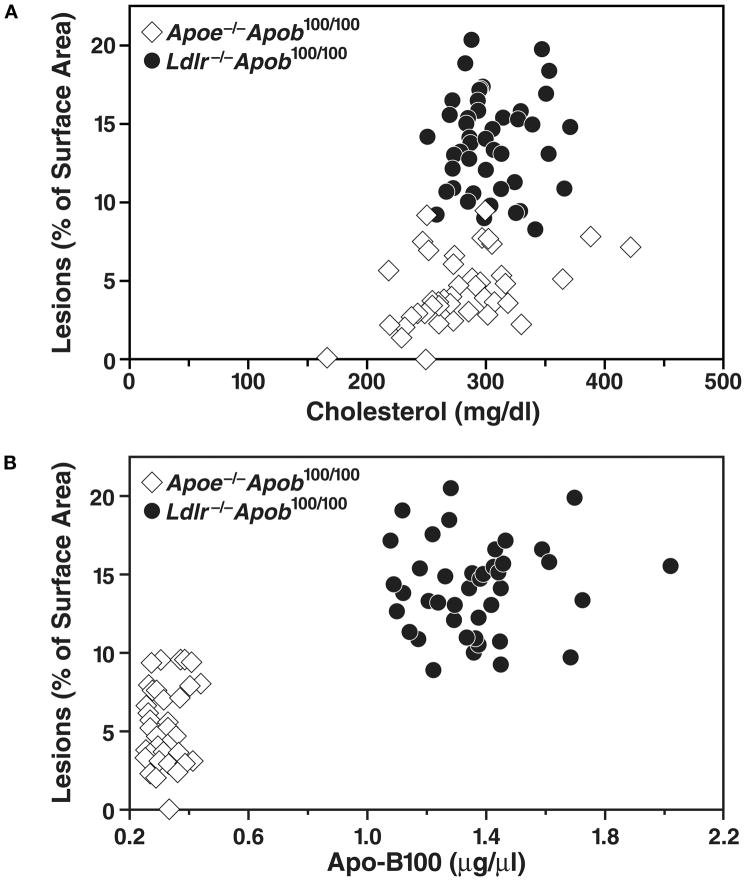
Figure 7.
Relationship between atherosclerotic lesions and the total plasma cholesterol levels and plasma apo-B100 levels in Apoe−/−Apob100/100 (n = 41) and Ldlr−/−Apob100/100 (n = 40) mice. The top panel shows a plot of lesions, as assessed by morphometric techniques, versus total plasma cholesterol levels (mean of the five measurements). The bottom panel shows a plot of lesions versus the plasma apo-B100 levels (measured at 32 weeks). Reproduced from a paper by Véniant et al. (25) with permission from the American Society of Clinical Investigation.

