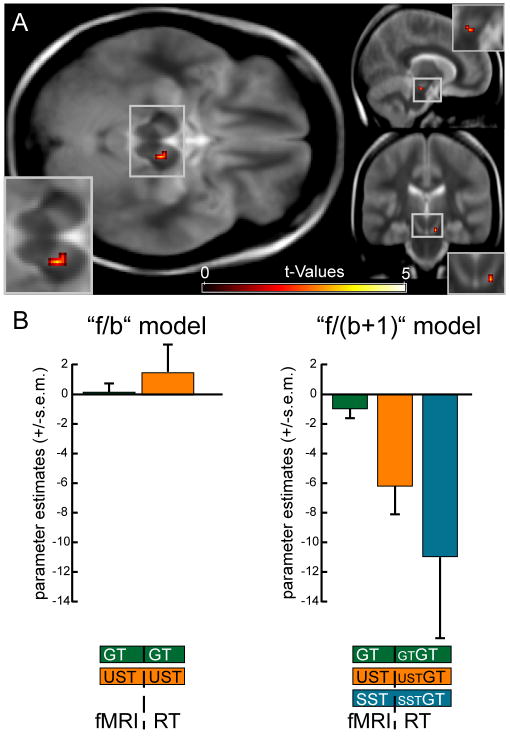
Fig. 2.
Results of the RT-regressor analysis (mean over subjects). (A) The f/(b+1) model revealed a negative relationship between hemodynamic responses in Stop-trials and RT fluctuations in the subsequent Go-trials (STGT) within the right SN (MNI coordinates of local activity maximum: x,y,z = 10,-22,-20). (B) Region of interest analyses revealed that this effect was only present for the RT regressors of the Go-trials following unsuccessful and successful Stop-trials (USTGT and SSTGT) in the f/(b+1) model.

