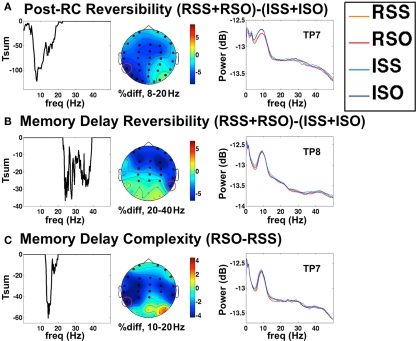
Figure 3.
Clusters of EEG oscillatory effects. Here, the left panel depicts the sum of t-values at each frequency point, rather than time point. The middle panel is the approximate topography of the effect (see text) in the indicated frequency range, and the right panel is the power spectra at a selected electrode. (A) Decrease in oscillatory power in the post-RC period following reversible vs. irreversible relative clauses. (B) Decrease in power during the post-sentence memory delay for sentences containing reversible vs. irreversible relative clauses. (C) Power decrease during the post-sentence memory delay following sentences containing reversible object-embedded vs. subject-embedded relative clauses.

