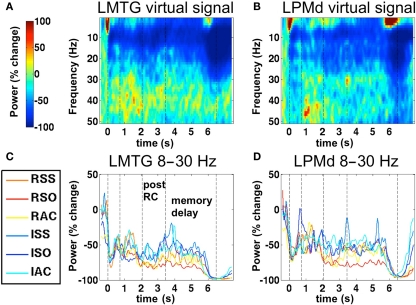
Figure 5.
Time–frequency decomposition of SAM virtual signals. (A) Time–frequency decomposition of virtual signals averaged across conditions, timelocked to the start of the sentence, extracted from left middle temporal gyrus (LMTG, Talairach coordinates −55, −52, +11). Dashed Vertical dashed lines indicate the average positions of the four digital triggers illustrated in Figure 1B. (B) Time–frequency decomposition of virtual signal extracted from Left Dorsal Premotor cortex (LPMD, Tal. −44, −2, +45). (C) Average timecourse of power in the 8–30 Hz band, in individual conditions, from the virtual signal in LMTG. (D) Average timecourse from virtual signals in LPMD.

