
Figure 2.
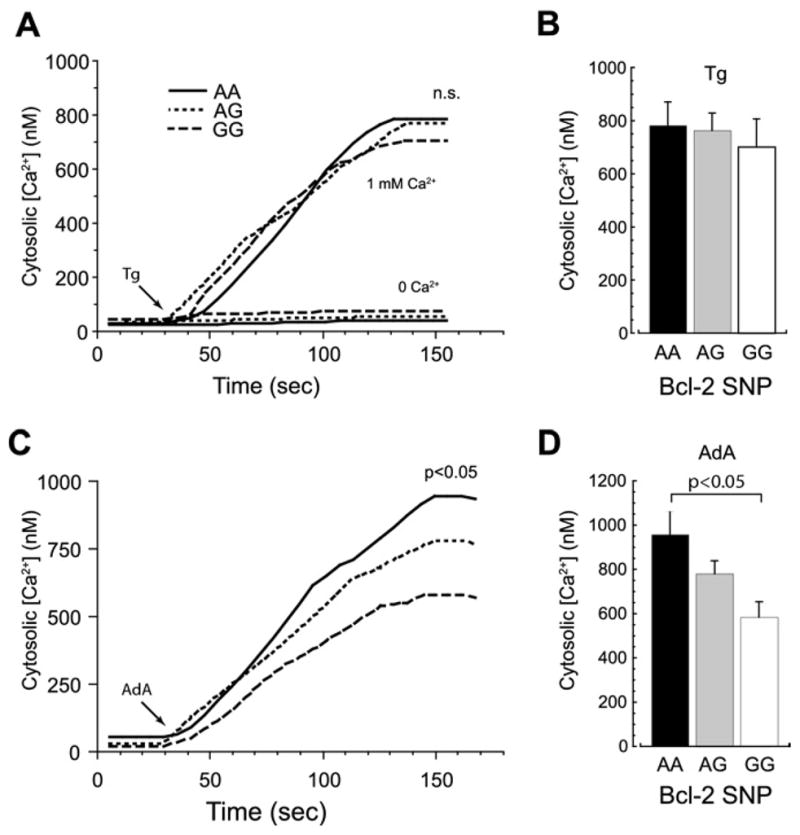
Cytosolic calcium dynamics in Bcl-2 SNP variants. (A) Representative cytosolic Ca2+ traces (fura-2) from BLCL of the three variants after stimulation with thapsigargin (Tg) (1 μmol/L) in Ca2+-free medium containing 200 μmol/L ethylene glycol bis-(β-aminoethyl ether)-N,N′-tetraacetic acid (lower traces) or medium containing 1 mmol/L extracellular Ca2+ (upper traces). Tg induced significant [Ca2+]i elevations only in the presence of extracellular Ca2+. (B) Average (per-patient) [Ca2+]i elevations in BLCL of the three different genotypes after Tg incubation in Ca2+-containing medium did not significantly differ. (C, D) Typical Ca2+ traces (C) and average [Ca2+]i elevations (D) in cells from the three Bcl-2 SNP variants after exposure to the InsP3R agonist adenophostin A (AdA) (75 nmol/L) in a medium containing 1 mmol/L extracellular Ca2+ revealed a graded, genotype-dependent response. The [Ca2+]i elevations in variant AA were significantly higher than in variant GG (p < .05). Other abbreviations as in Figure 1.