
Figure 2.
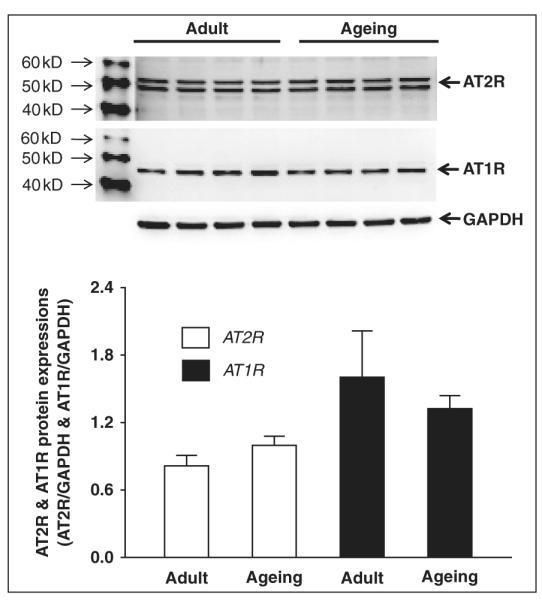
Western blot showing AT1R and AT2R protein expression in brainstem samples of adult and aged Fisher 344 rats. Panel A shows the original Western blot images (the upper bands are AT2R and the middle bands are AT1R) from all samples (four rats per group). Panel B shows the mean data for AT2R protein expression. Panel C shows the mean data for AT1R protein expression.