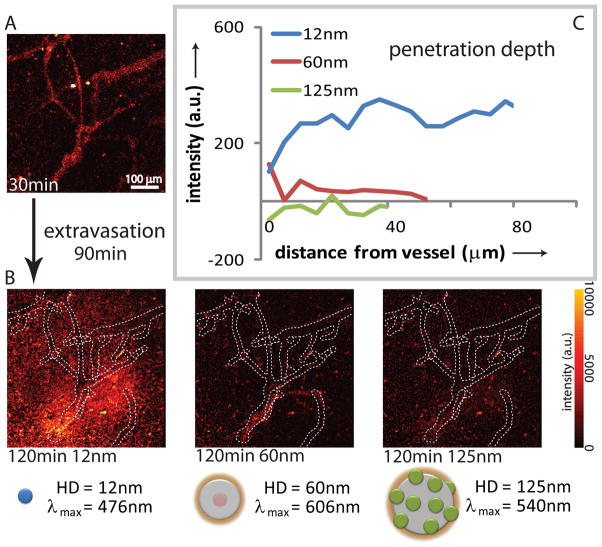
Figure 3.
Intravital imaging of size-dependent nanoparticle distribution in real time. Intravenous injection into a SCID mouse bearing an Mu89 melanoma in a dorsal skinfold chamber with a mixture of nanoparticles with diameters of 12 nm (476 nm emission), 60 nm (606 nm emission), and 125 nm (540 nm emission). a) Representative multiphoton microscopy image demonstrates the distribution of nanoparticles at 30 min after the injection. b) Multiphoton microscopy images demonstrate distribution of the nanoparitcle in the same resion as (a) at 120 min post-injection (red-yellow hues). The distribution at ~30 min is shown as, dotted white overlay based on 3D vascular tracing. Images are mean intensity projections of 3D volumes; scale bar – 100 μm. c) Penetration depth analysis at 60 min post-injection, with intensity profiles averaged over all 3D vectors normal to the vessels based on 3D vascular tracing. The images and analysis indicate that the 12nm particles effectively extravasate and diffuse away ~100 μm in 60 min, while the 60 nm particles remain within 10 μm of the vessel walls and the 125 nm particles do not appreciably extravasate.

