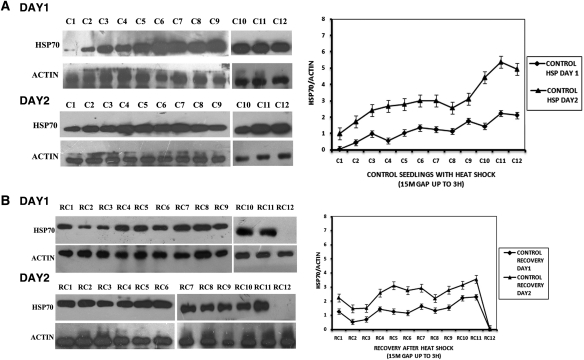
Fig. 1.
Protein expression in control seedlings on two consecutive days. (A) HSP70 protein expression in control seedlings with heat shock. C1—at 0 h of heat shock; C2—after 15 min of heat shock; C3—after 30 min of heat shock; C4—after 45 min of heat shock; C5—after 1 h of heat shock; C6—after 1 h 15 min of heat shock; C7—after 1 h 45 min of heat shock; C8—after 2 h of heat shock; C9—after 2 h 15 min of heat shock; C10—after 2 h 30 min of heat shock; C11—after 2 h 45 min of heat shock; C12—after 3 h of heat shock. (B) HSP70 protein expression in control seedlings in recovery at ambient temperature for 3 h after withdrawal of heat shock. RC1—at 0 h after withdrawal of heat shock; RC2—at 15 min after withdrawal of heat shock; RC3—at 30 min after withdrawal of heat shock; RC4—at 45 min after withdrawal of heat shock; RC5—at 1 h after withdrawal of heat shock; RC6—at 1 h 15 min after withdrawal of heat shock; RC7—at 1 h 45 min after withdrawal of heat shock; RC8—at 2 h after withdrawal of heat shock; RC9—at 2 h 15 min after withdrawal of heat shock; RC10—at 2 h 30 min after withdrawal of heat shock; RC11—at 2 h 45 min after withdrawal of heat shock; RC12—at 3 h after withdrawal of heat shock. The graphs on the right represent data expressed as band intensities of HSP70 normalized to actin. The error bars are standard errors of the means of two measurements (n= 2) from band density measurements of the same blot. The data are representative of 2–3 experiments.

