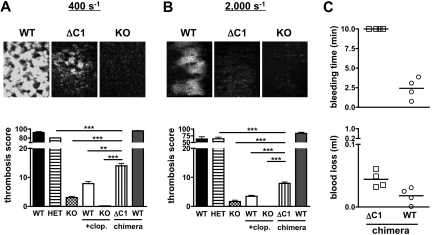
Figure 7.
Thrombosis and hemostasis in mice expressing CalDAG-GEFIΔC1 in circulating blood cells. (A-B) Platelet adhesion to collagen at 400 s−1 (A) or 2000 s−1 (B). (Top) Representative images (KO: CalDAG-GEFI−/−, ΔC1: CalDAG-GEFIΔC1). All images were obtained on a Nikon Eclipse Ti-U inverted microscope (Nikon) equipped with a Retiga EXL monochrome camera (QImaging) and the Nikon NIS Elements software (NIS-Elements Advanced Research). (Bottom)Thrombosis score (fluorescence intensity multiplied with area coverage after 5 minutes of perfusion) for the indicated genotypes (WT: wild-type; HET: CalDAG-GEFI+/−; KO: CalDAG-GEFI−/−; ΔC1: CalDAG-GEFIΔC1 chimera). n = 5-6, 3 independent experiments. (C) Bleeding time and blood loss volume determined in WT/GFP (circle) or CalDAG-GEFIΔC1/GFP (ΔC1/GFP, square) chimeric mice.

