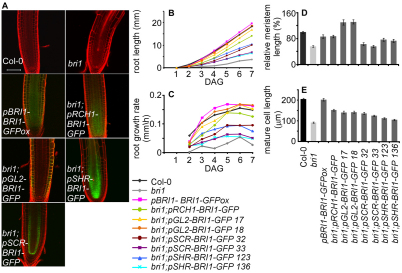
Fig. 4.
Root growth in lines expressing BRI1-GFP in specific cell files. (A) Confocal laser scanning microscope images of Col-0, bri1 and transgenic lines expressing BRI1-GFP are shown. pBRI1-BRI1-GFPox is in Col-0 background. All other transgenic lines are in bri1 background. BRI1-GFP is expressed under: pRCH1 (meristem); pGL2 (LRC and atrichoblasts); pSCR (endodermis and QC); pSHR (stele). Scale bar: 50 μm. (B,C) Root length in different days (B) and calculated growth rate (C) of Col-0, bri1 and the different transgenic lines. DAG, days after germination. (D) Relative root meristem length of Col-0, bri1 and the different transgenic lines. (E) Mature cortical cell length. Seven-day-old seedlings were analyzed. Results are presented as mean±s.e.m.

