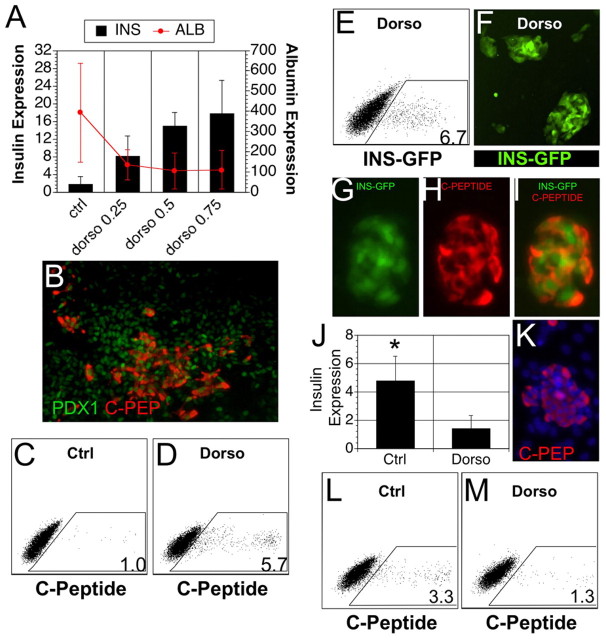
Fig. 6.
Pancreatic differentiation of different human pluripotent stem cells (hPSCs). (A) Quantitative PCR (QPCR) analysis for INS (black histogram) and ALB (red line) at d25 of differentiation in H1-derived populations generated in the presence of FGF10 alone (d7-10; ctrl) or FGF10 and 0.25 μM (dorso 0.25), 0.50 μM (dorso 0.50) or 0.75 μM (dorso 0.75) dorsomorphin. Line and bars represent mean±s.d. n=3. (B) Immunostaining for C-peptide (red) and PDX1 (green) at d27 in H1-derived cultures. (C,D) Flow-cytometric analysis of C-peptide at d25 of differentiation in untreated (Ctrl) and dorsomorphin-treated cultures (Dorso) of H1-derived cells. Percentage represents the mean percentage cells expressing C-peptide (s.d.=0.8 for D, n=3). (E) Flow cytometric analysis measuring GFP at d22 of differentiation in INS:GFP-HES3-derived populations. Cells were differentiated in the presence of 0.75 μM dorsomorphin (Dorso). Percentage represents the mean percentage of cells expressing GFP (s.d.=2.3%, n=4). (F) Presence of GFP+ clusters in the d22 population generated from the INS:GFP-HES3 cell line differentiated in the presence of 0.75 μM dorsomorphin (Dorso). (G-I) Immunostaining for C-peptide in day 22 INS:GFP HES3-derived populations. (J) QPCR analysis for INS in d25 populations generated from the 38-2 iPS cell line. Cells were differentiated in the absence (Ctrl) or presence of 0.75 μM dorsomorphin (Dorso). Bars represent mean±s.d. Asterisk indicates statistical significance determined by t-test. P=0.048, n=4. (K) Immunostaining for C-peptide in d27 populations generated from the 38-2 iPS cell line. (L,M) Flow-cytometric analysis of C-peptide at d25 of differentiation in 38-2-derived untreated (Ctrl) and dorsomorphin-treated populations (Dorso). Percentages represent the mean percentage of cells expressing C-peptide (s.d.=1.3% for L, n=4; s.d.=0.6% for M, n=3).

