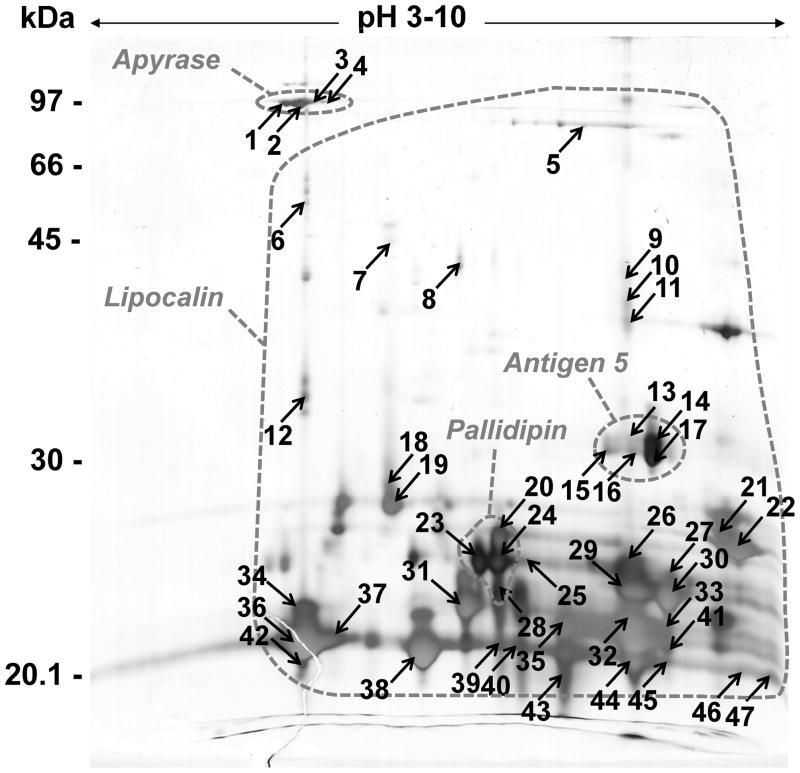
Figure 2.
Two-dimensional gel electrophoresis map of Dipetalogaster maxima secreted salivary proteins. IEF was performed from approximately 80 μg of saliva protein under denaturing conditions using a 3–10 linear IPG strip and following by 12% SDS-PAGE in a second dimension. The gel was silver stained. The dashed circles correspond to localizations of the different families of D. maxima identified proteins by MALDI-MS against the transcriptomic data. The spot numbers correspond to the identified proteins shown in supplemental table 1.

