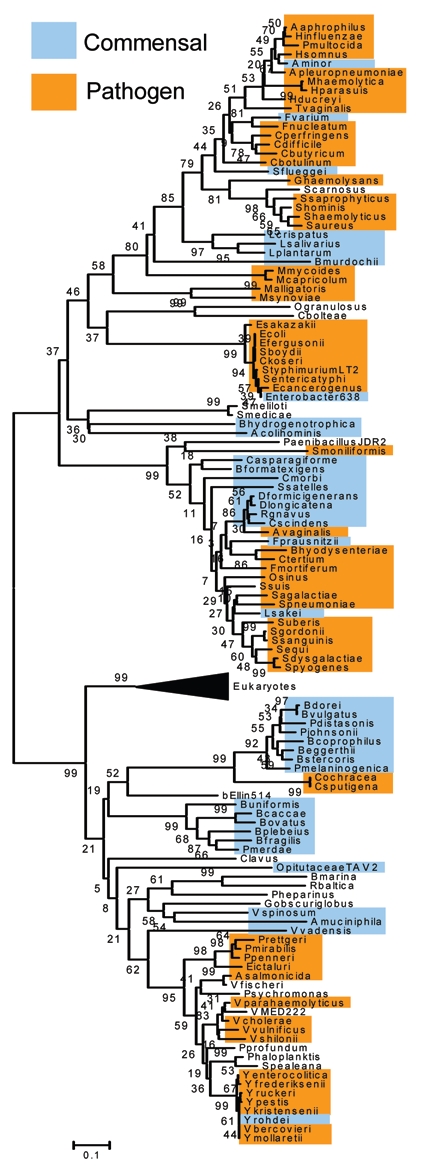
Figure 2.

Phylogenetic tree based on N-acetylneuraminic acid aldolase (NanA) sequences in the database. Commensal organisms are highlighted in blue. Pathogenic organisms are highlighted in orange. The tree was constructed with 121 bacterial NanA sequences using the Neighbor-Joining method with the bootstrap values obtained after 10,000 generations as implemented in MEGA4.38 The black triangle represents the collapsed branch of NanA from Eukaryotes.
