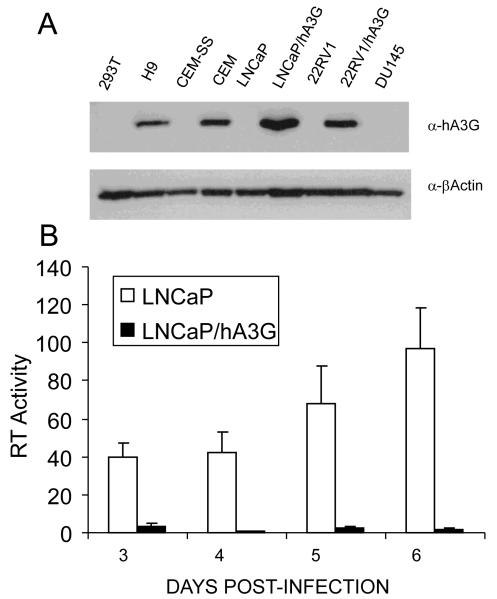
Figure 4. hA3G expression in prostate cancer cell lines and T-cell lymphoma cell lines.
A) This Western blot analyzes the level of hA3G expression in the hA3G-negative cell lines CEM-SS and 293T, the naturally hA3G-positive T-cell lines CEM and H9 and also in the parental prostate cancer cell lines 22RV1, DU145 and LNCaP. The polyclonal 22RV1/hA3G and LNCaP/hA3G cell lines were derived by lentiviral vector transduction. Endogenous β-actin was used as a loading control. B) The parental LNCaP cell line, and a transduced derivative expressing physiological levels of hA3G (panel A), were infected with XMRV virions produced by the wild type prostate cancer cell line 22RV1. At 2 days post-infection, the cells were split and supernatant RT levels monitored from day 3 to day 6 post-infection. RT activity is given in arbitrary units, average of three experiments with SD indicated.

