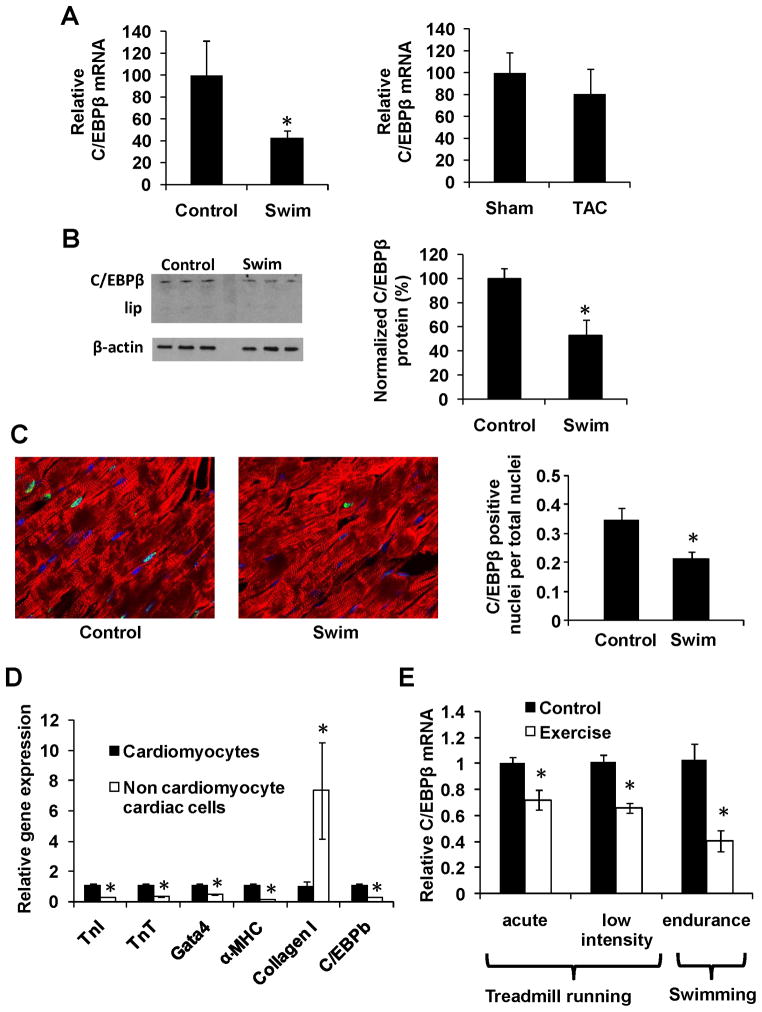
Figure 2. C/EBPβ is expressed in cardiomyocytes and down regulated with endurance exercise.
A. Cardiac C/EBPβ mRNA levels in a model for physiological (swim) and pathological (TAC) hypertrophy with respective controls (n=4) as described in methods. B. Western blot analysis of C/EBPβ and β-actin in the swim cohort (above) with subsequent quantification. Data is presented as percent of control with C/EBPβ relative to β-actin after background subtraction. C. Confocal microscopy after immunohistochemistry against C/EBPβ (green), α-actinin (red) and DAPI (blue) in cardiac tissue with subsequent quantification in indicated groups. Data is presented as the ratio of C/EBPβ positive cardiomyocyte nuclei. D. Gradient fractionation of primary rat neonatal cardiac cells followed by expression analysis of cardiomyocyte and fibroblast markers. E. Cardiac C/EBPβ mRNA levels from three different exercise regimens; “acute” = 40 minutes treadmill running (n=6), “low intensity” = 2 weeks of 30 minutes daily running (n=6) and “endurance” = the swimming protocol as described in methods (n=4). * indicates p<0.05 vs respective control using students t-test. Se also Supplemental Figure S2.

