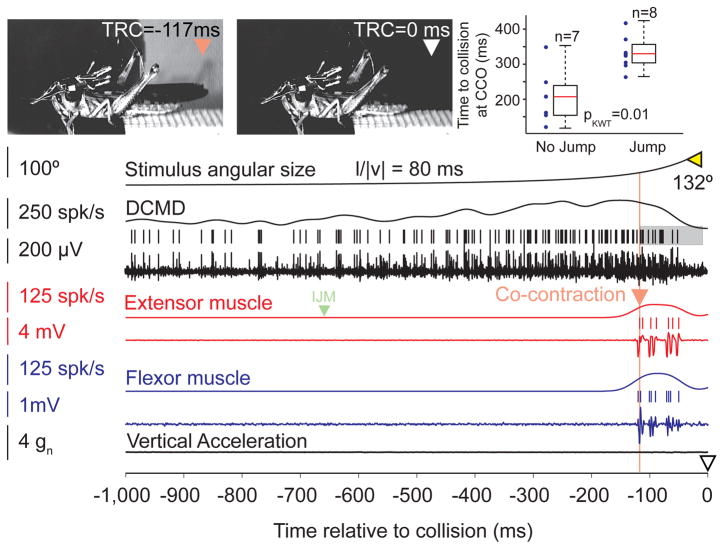
Figure 3.
Neural and muscle recordings during a trial in which the animal did not take off (see also Supp. Movie 2). The symbols  and ▽ mark the start of co-contraction, and the expected collision time, respectively (and corresponding video frames);
  marks the final angular size. The locust prepares to jump by co-contracting its flexor and extensor muscles, but never takes off (same animal as in Fig. 1). The shaded area around the DCMD spikes corresponds to the time period over which they were counted for further analysis (see Results). The right and left bounds are the co-contraction onset and the time at which the DCMD firing rate falls below 5 spk/s respectively. Top right: Co-contraction onset (CCO) occurred significantly earlier for jumps (all trials at l/|v| = 80 ms, same locust as in main panel). Individual trial values shown on left (dots); corresponding box plots on right.

