
Fig. 4.
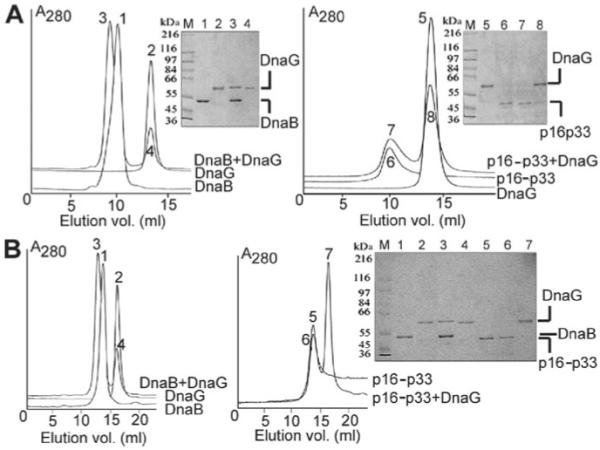
G-p33 and p16-p33 do not form a stable complex with DnaG.
A. The right panel shows a mixture of p16-p33 (969 nM hexamers) and DnaG (3.9 μM monomers) that was resolved through a Superdex S200 column and the elution profile compared with those of p16-p33 and DnaG alone. Samples from the peaks were analysed by SDS-PAGE. The left panel shows the same experiment carried out with DnaB and DnaG, for comparison.
B. The same experiment described in A was carried out but this time using a Superose 6 column.
For all the panels the arbitrary numbers on the peaks correspond to the same numbers of the lanes in the gel, as indicated. Molecular weight markers are shown in lane M.