
FIGURE 3.
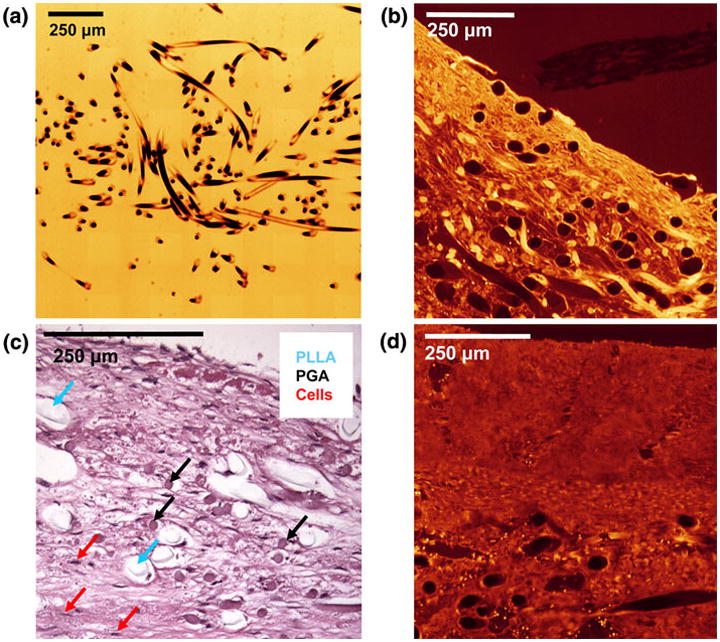
EV-SLCM imaging of pre-seeded scaffold (a) and PRI (b); hematoxylin and eosin staining of PRI time point specimen showing distinct PLLA and PGA scaffold fibers (c), and EV-SLCM imaging of POI (d). Note the tissue contraction around the PLLA in Fig. 3c, while the PGA shows intimate contact with the surrounding tissue. A similar histological image of a POI time point specimen was used to obtain corrected PLLA diameters for area fraction calculations.