
Figure 3.
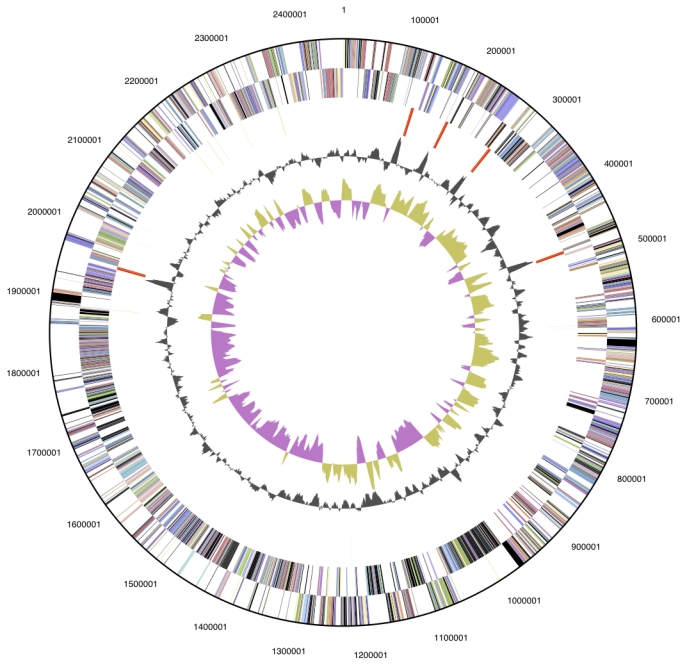
Graphical circular map of the genome. From outside to the center: Genes on forward strand (color by COG categories), Genes on reverse strand (color by COG categories), RNA genes (tRNAs green, rRNAs red, other RNAs black), GC content, GC skew.