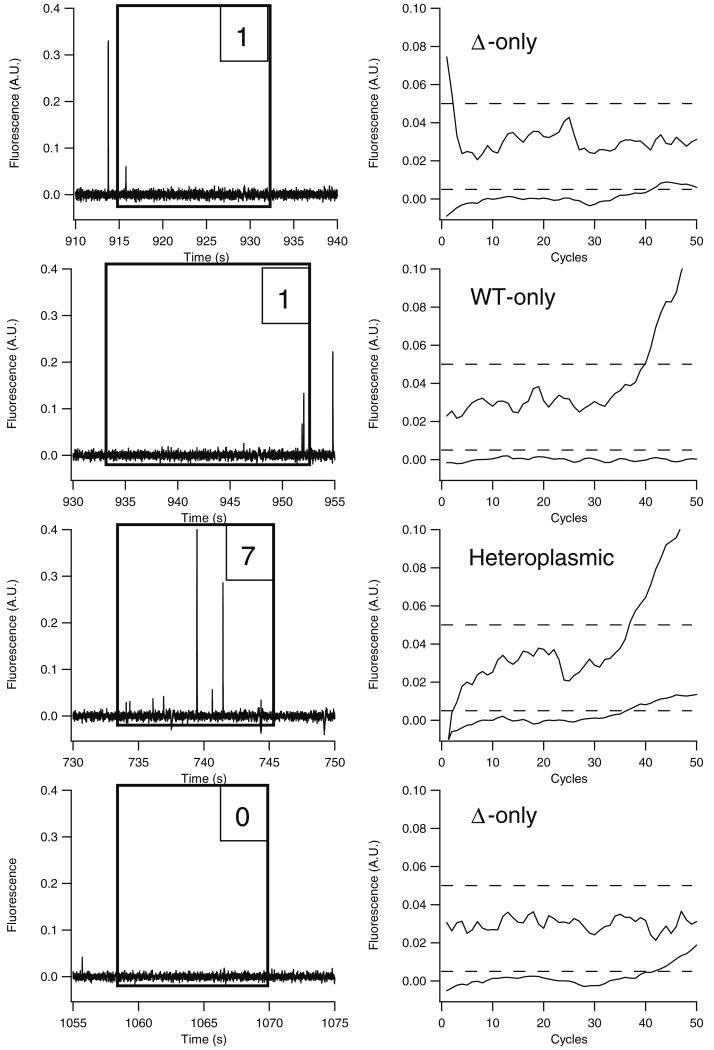
Fig. 3.
Detection of isolated mitochondria by capillary cytometry. Mitochondria from ΔH2-1 cybrid cells were hydrodynamically driven through a poly(acryloylaminopropanol)-modified capillary at approximately 0.16 cm/s. Laser-induced fluorescence detection was performed on-column, and mitochondria were collected into PCR wells. PCR reagents were added to each PCR well following collection, and 50 cycles of amplification were performed. Each cytogram (left column) has a box overlaid to indicate the collection window and the number of mitochondria detected in each window. Beside each cytogram is the corresponding real-time PCR amplification plot. In each amplification plot, the wild-type mtDNA trace is offset by 0.03 fluorescence units for clarity, and the dashed line represents the fluorescence threshold used to determine the threshold cycle

