Figure 2.

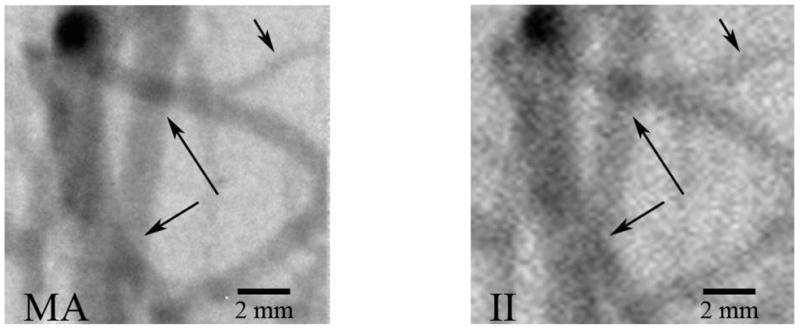
Typical DSA image of rabbit neurovasculature illustrating increased small vessel visualization (upper right arrow) and vessel overlap detectability (central two arrows) with the high-resolution MA.

Typical DSA image of rabbit neurovasculature illustrating increased small vessel visualization (upper right arrow) and vessel overlap detectability (central two arrows) with the high-resolution MA.