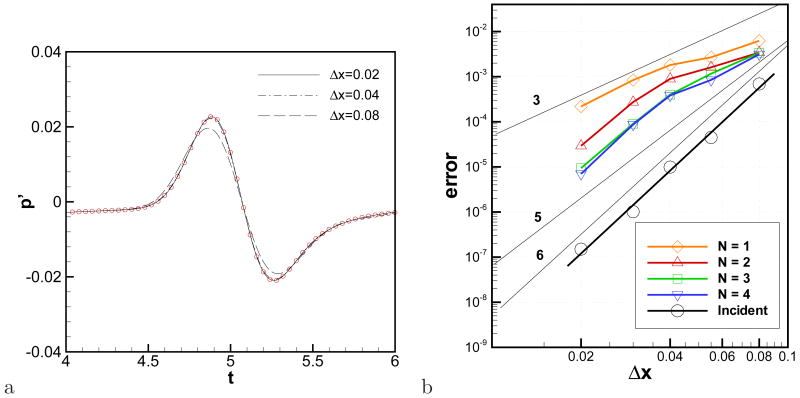
Figure 7.
a) Time histories of pressure fluctuation at (x, y) = (2, 0) for the first reflected wave. Symbols: analytical solution. b) Errors for the incident wave (black line, circular symbols) and the first reflected wave (other lines). Errors are computed for the time signal at (x, y) = (2, 0) with respect to the analytical solution at the peak time.

