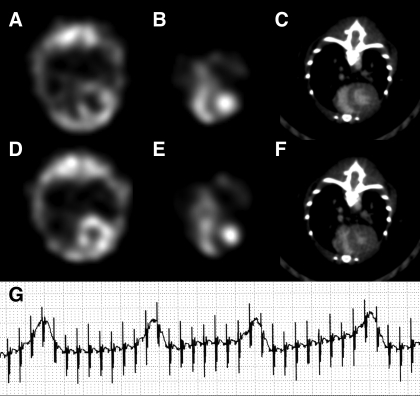
Figure 3.
Example of mouse ECG-gated SPECT–CT midthoracic axial slice images with cubic voxels of 0.9 × 0.9 × 0.9 mm3 and 0.1 × 0.1 × 0.1 mm3, respectively. Myocardial left ventricle perfusion 201Tl SPECT at (A) end-diastole and (D) end-systole. Blood-pool 99mTc SPECT of both ventricles in (B) end-diastole and (E) end-systole. Contrast CT midventricular slices in (C) end-diastole and (F) end-systole. (G) Typical ECG recording during SPECT–CT image acquisition.

